


26 October 2026 | Admin
Most companies don't have a data problem. They have a "where did I see that number?" problem.
Sales are in one tool. Customer details are somewhere else. Stock lives in a spreadsheet, and only Rakesh from accounts knows which tab matters. Everything is recorded. Almost nothing is easy to read. That's what business intelligence is meant to fix: you gather the scattered pieces and show them in a form people can actually use.
What Is a Business Intelligence Dashboard?
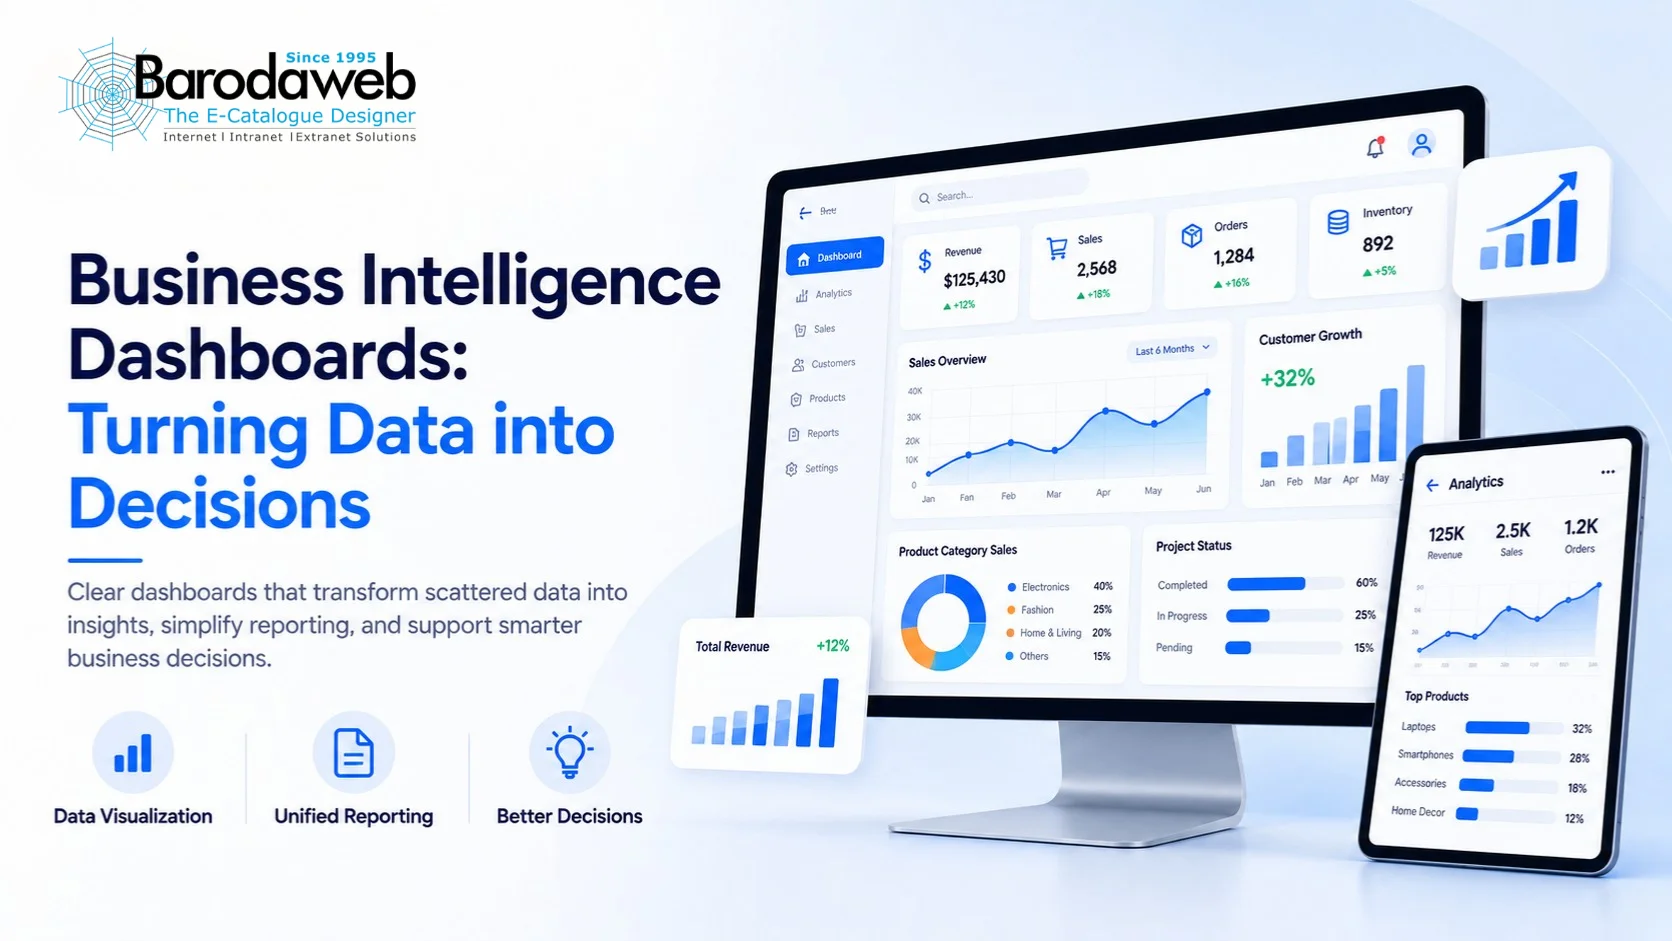
A BI dashboard is one screen with the numbers you care about.
Before, you'd open three files, squint, and try to hold everything in your head. Now you open one page and you're done. I think that's the whole appeal, honestly. It saves time and it saves patience.
What shows up depends on who's looking. A sales lead wants customers and deals. Someone in operations wants stock, output and late projects. Same tool, different screen.
Why Businesses Need More Than Raw Data?
Thousands of rows of figures can still leave you clueless. Plenty of people have sit in front of exactly that.
Business analytics starts when you stop collecting and start asking. Why did sales slow down a few months ago? Why is one product suddenly selling well? Why is one team beating the other when they sell the same thing?
The data won't answer all of that by itself. It does tell you where to look first, and that matters more than people think.
How Data Visualization Makes Information Easier to Understand?
Long tables are tiring. Nobody reads forty rows with full attention.
Data visualization draws those same figures as lines, bars and comparisons. A year of monthly sales as a list means reading each number and remembering the last one. As a chart, you spot the dip and the jump almost instantly.
Keep it simple, though. A plain chart usually beats a fancy one. If people have to work out how to read it, it's failed.
From Reports to a More Useful Reporting Dashboard
Reports still matter. When you need detail on one department or one quarter, open the report.
But most mornings you just want to know if something's wrong. A reporting dashboard shows the key figures together, so you can check quickly and only go deeper if something looks off.
So the dashboard is the front page, and the report is the full story.
Turning Data into Business Data Insights
A good dashboard makes you say, "Wait, why is that happening?"
Say sales jumped last month. Was it a festival, a discount, one big customer? Or say they dropped and nobody knows why. You might compare this year's customer activity with last year's, or put two departments side by side. Questions like these lead to business data insights , which are the practical kind that help you decide what to stock, where to put effort and what to fix first.
The dashboard won't make the decision. You do. It just stops you from guessing.
How Business Intelligence Supports Better Decisions
A dashboard nobody opens is decoration. What counts is whether people use it.
When information is clear, managers spend less time chasing numbers and more time thinking. Meetings get easier too, because everyone's looking at the same figures instead of arguing over whose sheet is right. And you can focus on what matters instead of whatever is shouting loudest.
There's no dashboard that suits every company, though. A shop and a software firm care about different things, and their systems and reporting habits differ as well. Whatever you build should fit your business, not someone else's.
Choosing the Right Business Intelligence Approach
Before building anything, someone has to ask what the business needs from it. That's where Barodaweb's Business Intelligence service starts: the client's goals and challenges first, then the right BI approach. Its website also mentions proven open technologies, so the solution can work with other platforms and applications.
I like that order. Lots of BI projects go the other way. The tool gets built, the question gets asked later, and nobody opens the result.
Get it right and business intelligence shows you what's really going on across the company. Once you can see that, the next decision gets easier.